
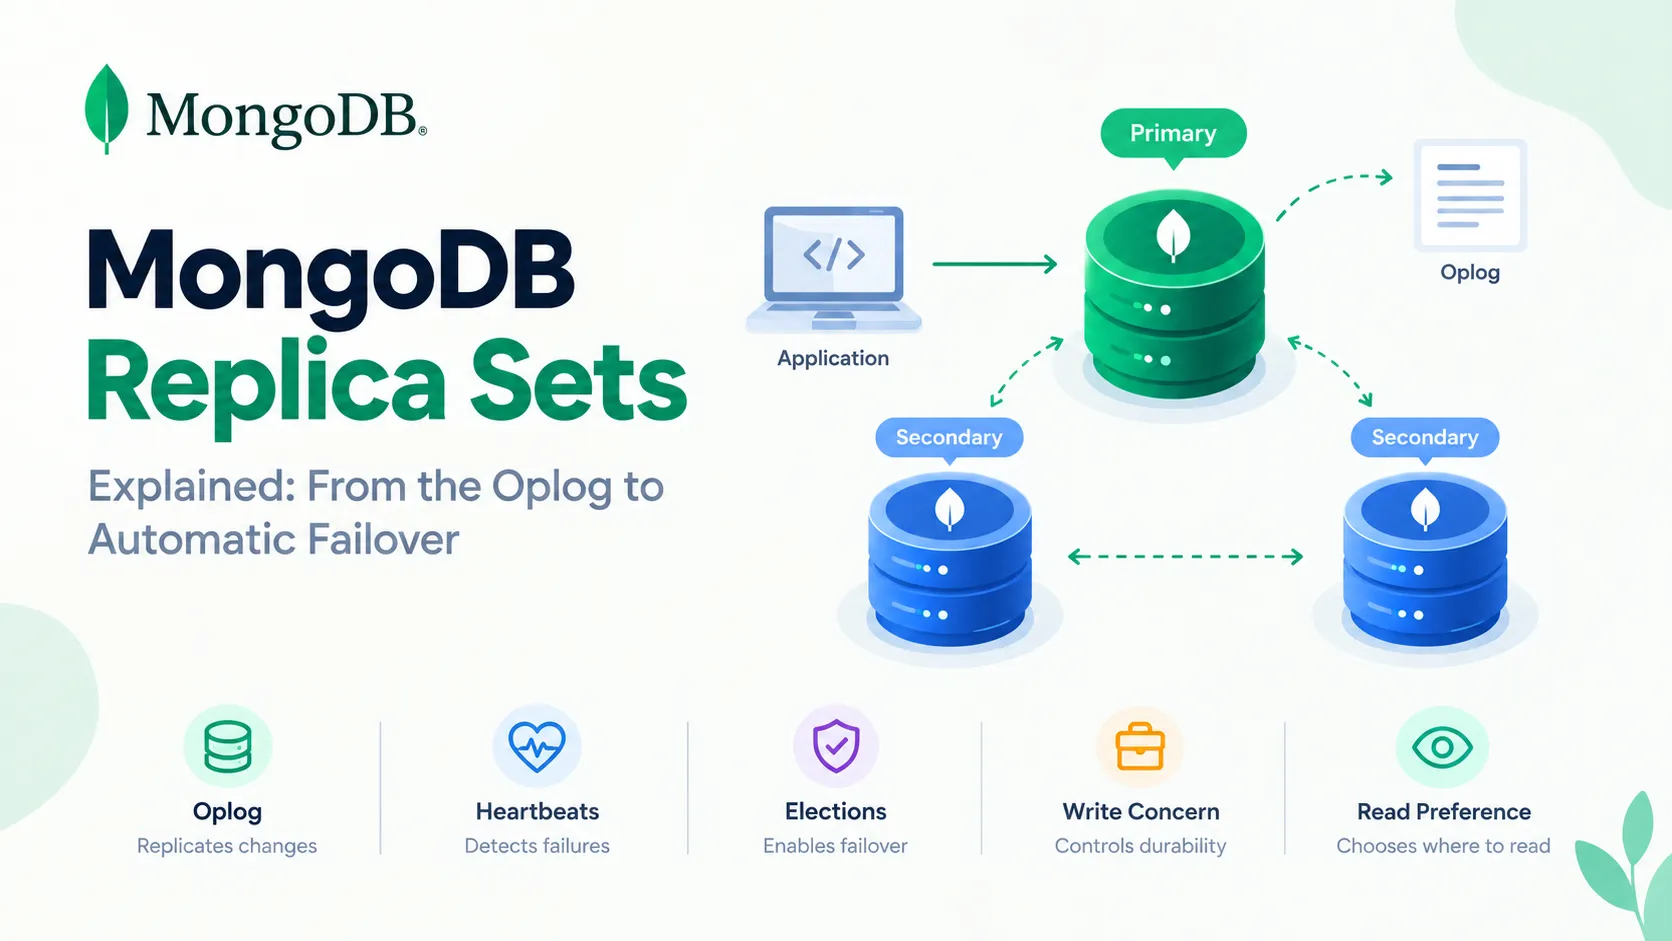
Maintaining High Availability with MongoDB Replication
This is to understand how MongoDB replica sets work through visual animations and hands-on Docker experiments. Learn how the oplog, heartbeats, elections, write concern, and read preference work together to keep your database available and your data consistent.
The first time I read the official replication docs, I understood every sentence and still couldn't have told you how the thing worked. Each page is correct. They're just written like a reference manual, and a reference manual is a bad way to build a mental model.
So this post is the version I wish I'd had. We'll go through how a MongoDB replica set behaves, one idea at a time, with a small animation for each idea. In the middle we'll spin up a real three-node set on your machine and break it on purpose, because that's where it finally clicks.
If you only remember one thing from this post, make it this: replication is just one server writing down what it did, and other servers copying that list. Everything else (elections, write concern, read preference) is a consequence of that.
Here's the plan:
- What a replica set is
- Run one locally
- The oplog, the list everyone copies
- Heartbeats
- Failover and elections
- Write concern
- Read preference
- Lag, monitoring and the usual mistakes
What a replica set actually is
A replica set is a group of mongod processes that keep the same data. That's it. One member is the primary. It's the only one that accepts writes. The others are secondaries, and they copy whatever the primary does.
Why bother? Two reasons. If a server dies, you still have your data. And if the primary dies, the remaining members can pick a new primary on their own, so your app keeps working without someone getting paged at 3 a.m. to run a command by hand.
Here's the whole flow for a single write:
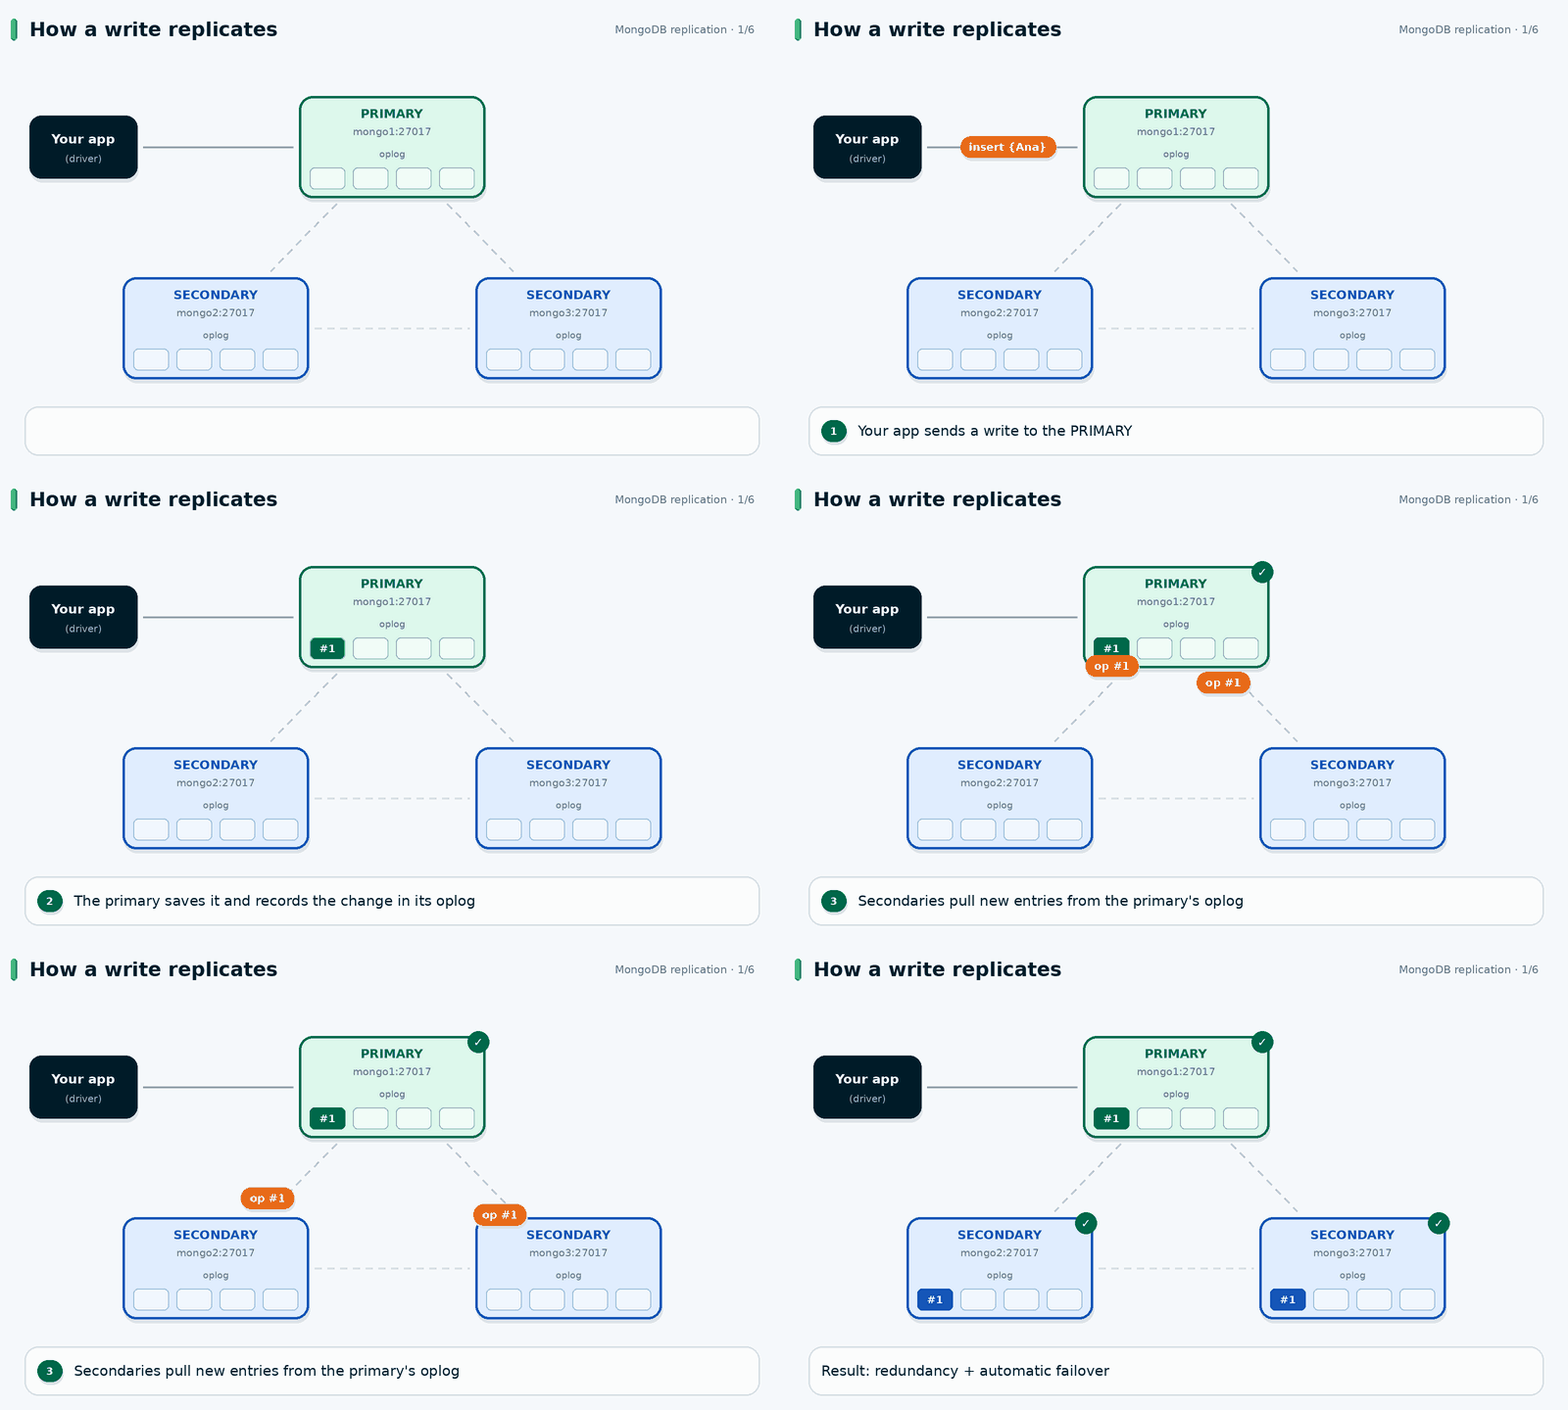
Your app writes to the primary. The primary saves it and records the change in its oplog. Secondaries pull the new entry and apply it.
Notice the direction of the arrows in step 3. The primary doesn't push data out to secondaries. Secondaries pull. They keep asking "anything new since the last entry I have?" That detail explains a lot of behavior later, like why a slow secondary can fall behind without slowing down the primary.
A few facts worth knowing before we go on:
- A replica set can have up to 50 members, but only 7 of them can vote in elections. Most real deployments use 3 or 5.
- Only the primary takes writes. There's no multi-primary mode in a replica set. (If you need to spread writes across machines, that's sharding, a different topic.)
- Your application doesn't need to know which member is the primary. The driver figures it out from the connection string. We'll get to that.
Let's run one
Reading about this is fine, but you'll learn faster with a set you can poke at. You need Docker and nothing else.
Create a docker-compose.yml:
services:
  mongo1:
    image: mongo:7
    container_name: mongo1
    command: ["--replSet", "rs0", "--bind_ip_all", "--port", "27017"]
    ports: ["27017:27017"]

  mongo2:
    image: mongo:7
    container_name: mongo2
    command: ["--replSet", "rs0", "--bind_ip_all", "--port", "27018"]
    ports: ["27018:27018"]

  mongo3:
    image: mongo:7
    container_name: mongo3
    command: ["--replSet", "rs0", "--bind_ip_all", "--port", "27019"]
    ports: ["27019:27019"]
Each member listens on its own port. That looks odd, but it saves you a headache later. When you connect from your laptop, the driver discovers members using the hostnames stored in the replica set config, not the address you typed. If all three used port 27017, those hostnames would collide on your machine.
Start them:
docker compose up -d
At this point you have three MongoDB servers that know they should be in a set called rs0, but nobody has told them who the other members are. Do that once, from any one of them:
docker exec -it mongo1 mongosh --eval '
rs.initiate({
  _id: "rs0",
  members: [
    { _id: 0, host: "mongo1:27017" },
    { _id: 1, host: "mongo2:27018" },
    { _id: 2, host: "mongo3:27019" }
  ]
})'
Give it a few seconds, then look at the result:
docker exec -it mongo1 mongosh --eval 'rs.status().members.map(m => m.name + " " + m.stateStr)'
You should see something like this (which member wins the first election can vary):
[
  'mongo1:27017  PRIMARY',
  'mongo2:27018  SECONDARY',
  'mongo3:27019  SECONDARY'
]
Congratulations, you have a replica set. Leave it running. We'll break it later.
If you want to connect from your laptop (not from inside a container), add this line to your
/etc/hostsfile so the hostnames in the config resolve:127.0.0.1 mongo1 mongo2 mongo3Then use this connection string:
mongodb://mongo1:27017,mongo2:27018,mongo3:27019/?replicaSet=rs0
Notice that the connection string lists all the members plus replicaSet=rs0. You're not telling the driver where the primary is. You're giving it a few doors to knock on, and it asks the set who's in charge. That's what makes failover invisible to your code later.
The oplog: the list everyone copies
Now for the heart of it. Every write on the primary gets recorded in a special collection called the oplog, which lives at local.oplog.rs. Secondaries read that collection and replay the operations in the same order. Same operations, same order, same data.
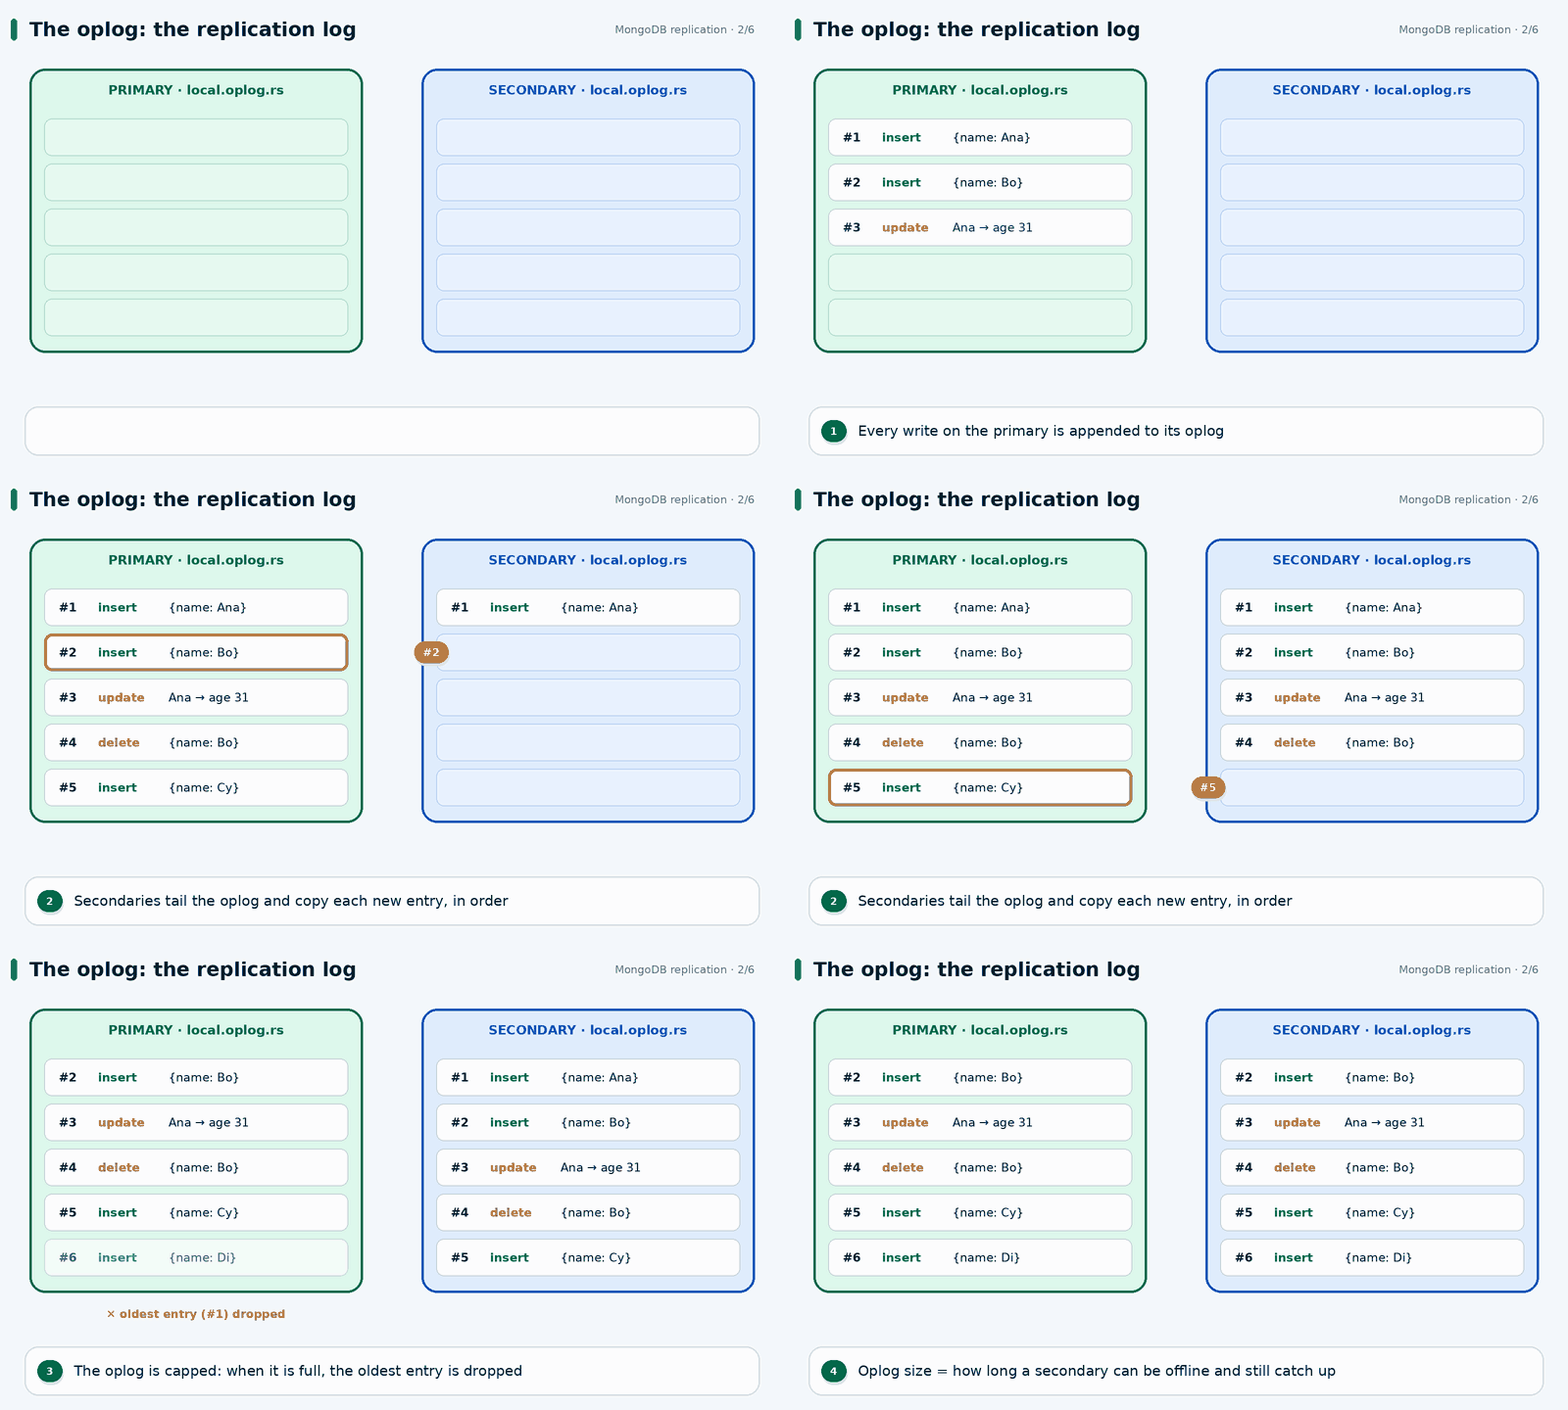
Entries are appended on the primary, copied by the secondary in order, and the oldest ones fall off the end when the oplog is full.
You can see it yourself. Insert something, then look at the last oplog entry:
// in mongosh, connected to the primary
use shop
db.orders.insertOne({ item: "notebook", qty: 2 })

use local
db.oplog.rs.find().sort({ $natural: -1 }).limit(1).pretty()
You'll get a document along these lines (trimmed):
{
  op: 'i',                    // i = insert, u = update, d = delete
  ns: 'shop.orders',          // which collection
  o: { _id: ObjectId('...'), item: 'notebook', qty: 2 },
  ts: Timestamp({ t: 1761700000, i: 1 }),
  t: Long('1')                // the election "term"
}
Two things about the oplog that surprise people.
It's idempotent. Replaying the same entry twice gives the same result as replaying it once. MongoDB achieves this by rewriting operations before logging them. If you run { $inc: { qty: 1 } }, the oplog doesn't store "add one". It stores the resulting value, so applying it again can't double-count. That's what makes it safe for a secondary to restart mid-sync and pick up where it left off.
It's capped. The oplog is a fixed-size collection. When it fills up, the oldest entries are overwritten by new ones, which is the "oldest entry dropped" moment in the animation above. This has a real consequence. If a secondary is offline for longer than your oplog covers, the entries it needs are gone, and it can't catch up by replaying. It has to do a full initial sync, copying all the data again. Not the end of the world, but slow on a big dataset.
So how much time does your oplog cover? Ask it:
rs.printReplicationInfo()
configured oplog size:   990MB
log length start to end: 87423secs (24.28hrs)
oplog first event time:  Wed Oct 28 2026 07:02:11 GMT+0000
oplog last event time:   Thu Oct 29 2026 07:19:34 GMT+0000
now:                     Thu Oct 29 2026 07:19:40 GMT+0000
That log length line is your safety window. Here it's about 24 hours: a secondary can be down for a day and still catch up by replaying. On a busy production system with big batch writes, that window can shrink to minutes without anyone noticing, so it's worth checking occasionally. You can resize it without restarting:
// size is in megabytes
db.adminCommand({ replSetResizeOplog: 1, size: 16384 })
Heartbeats: how the set knows who's alive
Replication copies data. But how does the set know a member has died? Through a very low-tech mechanism: everyone keeps pinging everyone else.
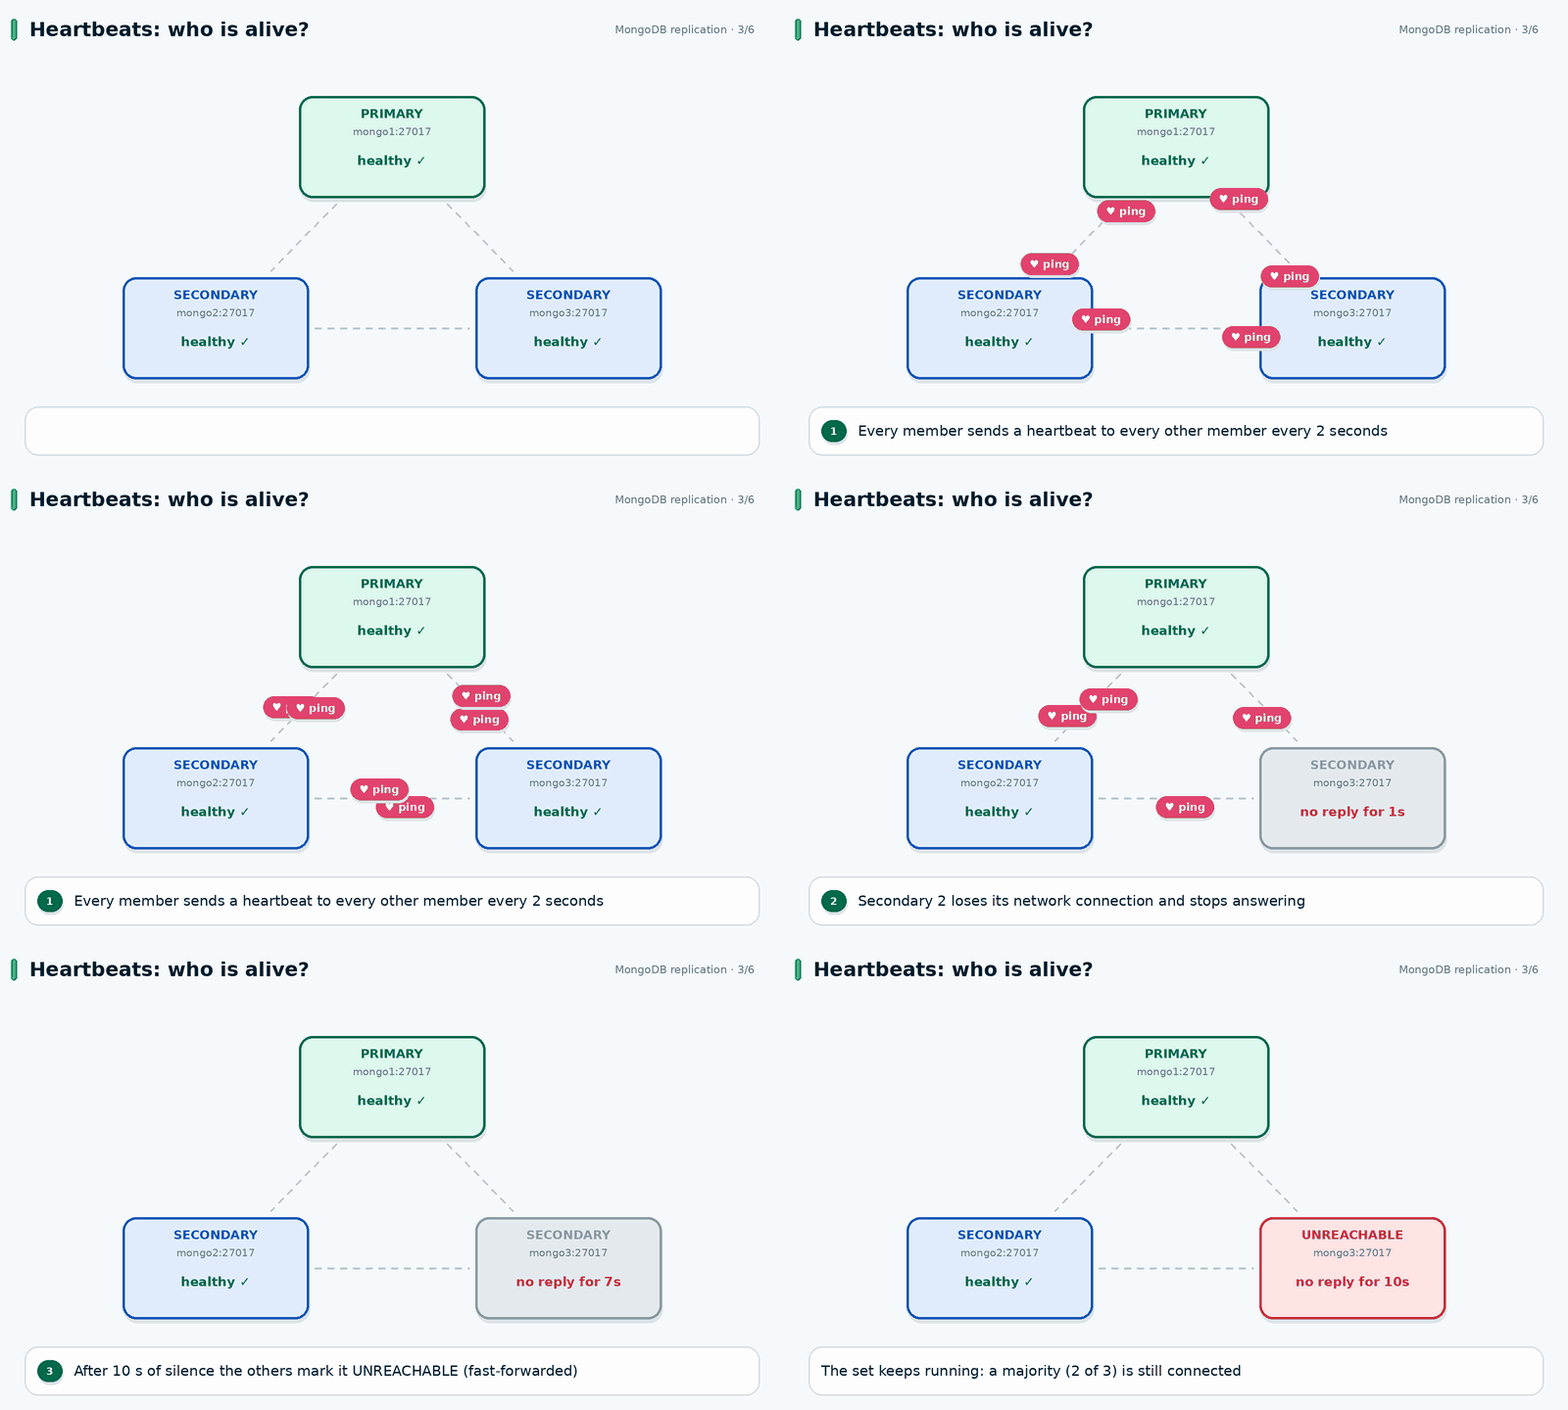
Every member pings every other member every 2 seconds. A member that stays silent long enough gets marked unreachable.
Each member sends a heartbeat to every other member every 2 seconds. If a member hasn't answered for 10 seconds (the default electionTimeoutMillis), the others treat it as gone. In the animation I fast-forward that 10 seconds, but in real life you'd wait the full 10.
You can see the heartbeat data in rs.status():
rs.status().members.forEach(m =>
  print(m.name, m.stateStr, "health:", m.health, "lastHeartbeat:", m.lastHeartbeat)
)
Here's something that trips people up. "Unreachable" doesn't mean "dead". It means I can't hear it. The member might be crashed, or the network between two machines might be broken while both are perfectly healthy. A member can't tell the difference from the inside. That uncertainty is the reason elections need a majority instead of just "whoever notices first", and it's exactly where we're headed next.
Failover: what happens when the primary dies
This is the part everyone is secretly here for. Let me narrate the animation first, then you'll break your own cluster to watch it happen for real.
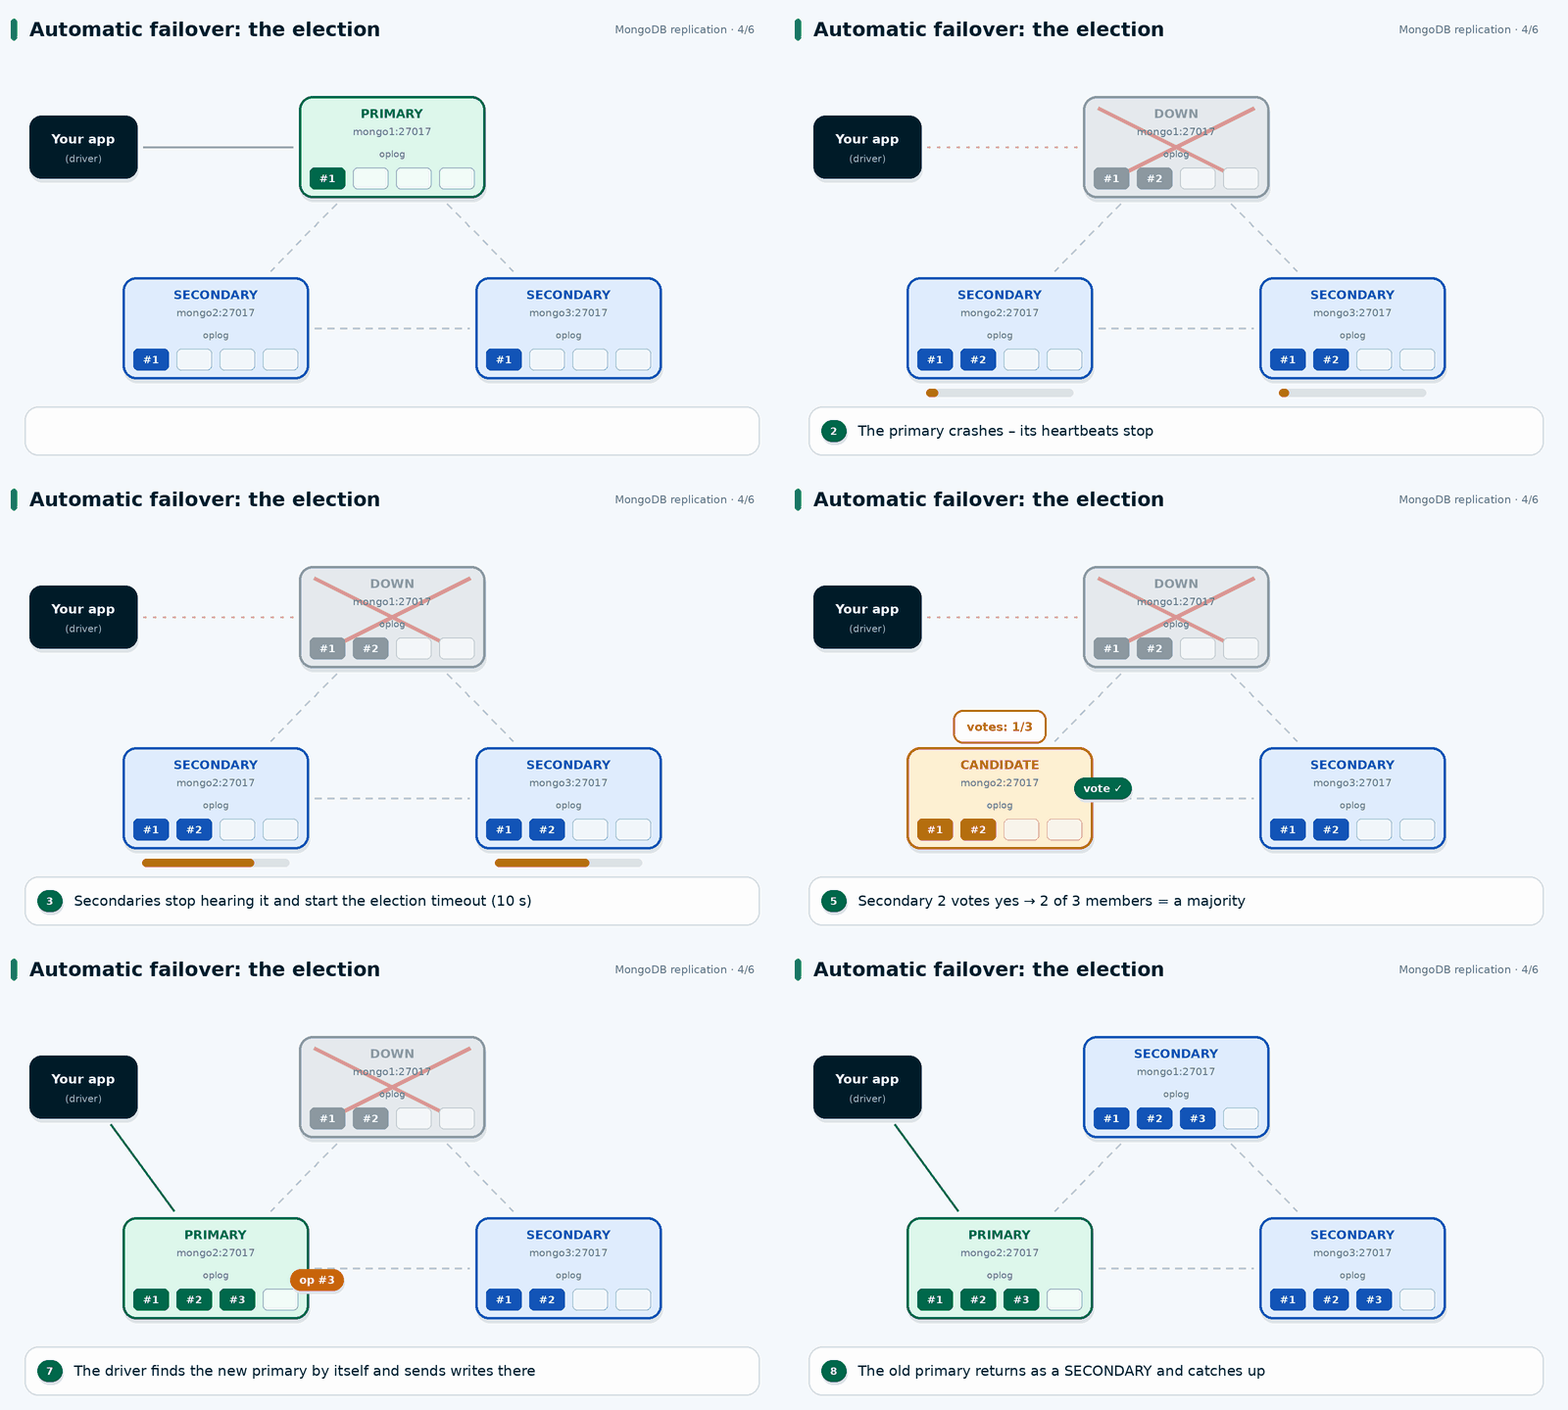
The primary crashes, a secondary calls an election, wins a majority and takes over. The old primary comes back later as a secondary.
Step by step:
- The primary stops responding. Heartbeats from it stop arriving.
- The secondaries wait. They don't panic immediately. They run the election timeout (10 seconds by default) with a little randomness added, so they don't all start an election at the same instant.
- One secondary times out first. It becomes a candidate, votes for itself, and asks the others for votes.
- The other member votes yes, as long as the candidate's data is at least as up to date as its own. This check matters. It stops a stale secondary from becoming primary and losing writes.
- A majority is reached. With 3 voting members, a majority is 2. The candidate has its own vote plus one more, so it wins and becomes the new primary.
- Your app carries on. The driver notices the topology change and sends writes to the new primary. When the old primary comes back, it rejoins as a secondary and catches up from the oplog.
The whole thing typically takes a handful of seconds up to roughly 12 seconds, counting the detection time.
Break it yourself
Open the shell and write a document so there's some data, then kill the primary:
docker stop mongo1
Now ask a surviving member who's in charge:
docker exec -it mongo2 mongosh --port 27018 --eval \
  'rs.status().members.map(m => m.name + "  " + m.stateStr)'
[
  'mongo1:27017  (not reachable/healthy)',
  'mongo2:27018  PRIMARY',
  'mongo3:27019  SECONDARY'
]
Bring the old one back and watch it settle in as a secondary:
docker start mongo1
If you want a gentler test that doesn't kill anything, ask the primary to step down voluntarily. This is also what you'd use before maintenance:
rs.stepDown(60) // step down, and don't try to become primary again for 60 seconds
Why three members and not two
People ask this a lot. Two members seems like enough: one primary, one backup. But think about what a majority means. With 2 voters, a majority is 2. If either member goes down, the survivor has only 1 of 2 votes, which isn't a majority. It can't elect itself, and the set goes read-only. You've paid for two servers and got less availability than one, since either failing now takes you down.
With 3 voters a majority is 2, so you can lose any one member and still elect. With 5 voters you can lose two. That's why you see odd numbers everywhere.
If you really can't afford a third data-bearing server, MongoDB lets you add an arbiter: a member that votes but stores no data. It works, and it comes with trade-offs, especially around write concern. If you can, run a real third member instead.
Preferring a particular primary
Sometimes one machine is simply better (more RAM, closer to your app). You can bias elections toward it with priority:
cfg = rs.conf()
cfg.members[0].priority = 2   // default is 1
rs.reconfig(cfg)
Priority only influences who wins. It doesn't let a member become primary without a majority.
What about the write that was in flight?
Modern drivers have retryable writes turned on by default. If a write fails because the primary just disappeared, the driver waits for a new primary and retries it once. For most apps, a failover looks like a slightly slow request instead of an error. It isn't magic, though. If your app does something non-idempotent outside the database, you still own that logic.
Write concern: when is a write "done"?
Now a question the animations so far have skipped. When your app calls insertOne, at what point does MongoDB say "success"? The answer is controlled by write concern, and it's one of the most important settings in the whole system.
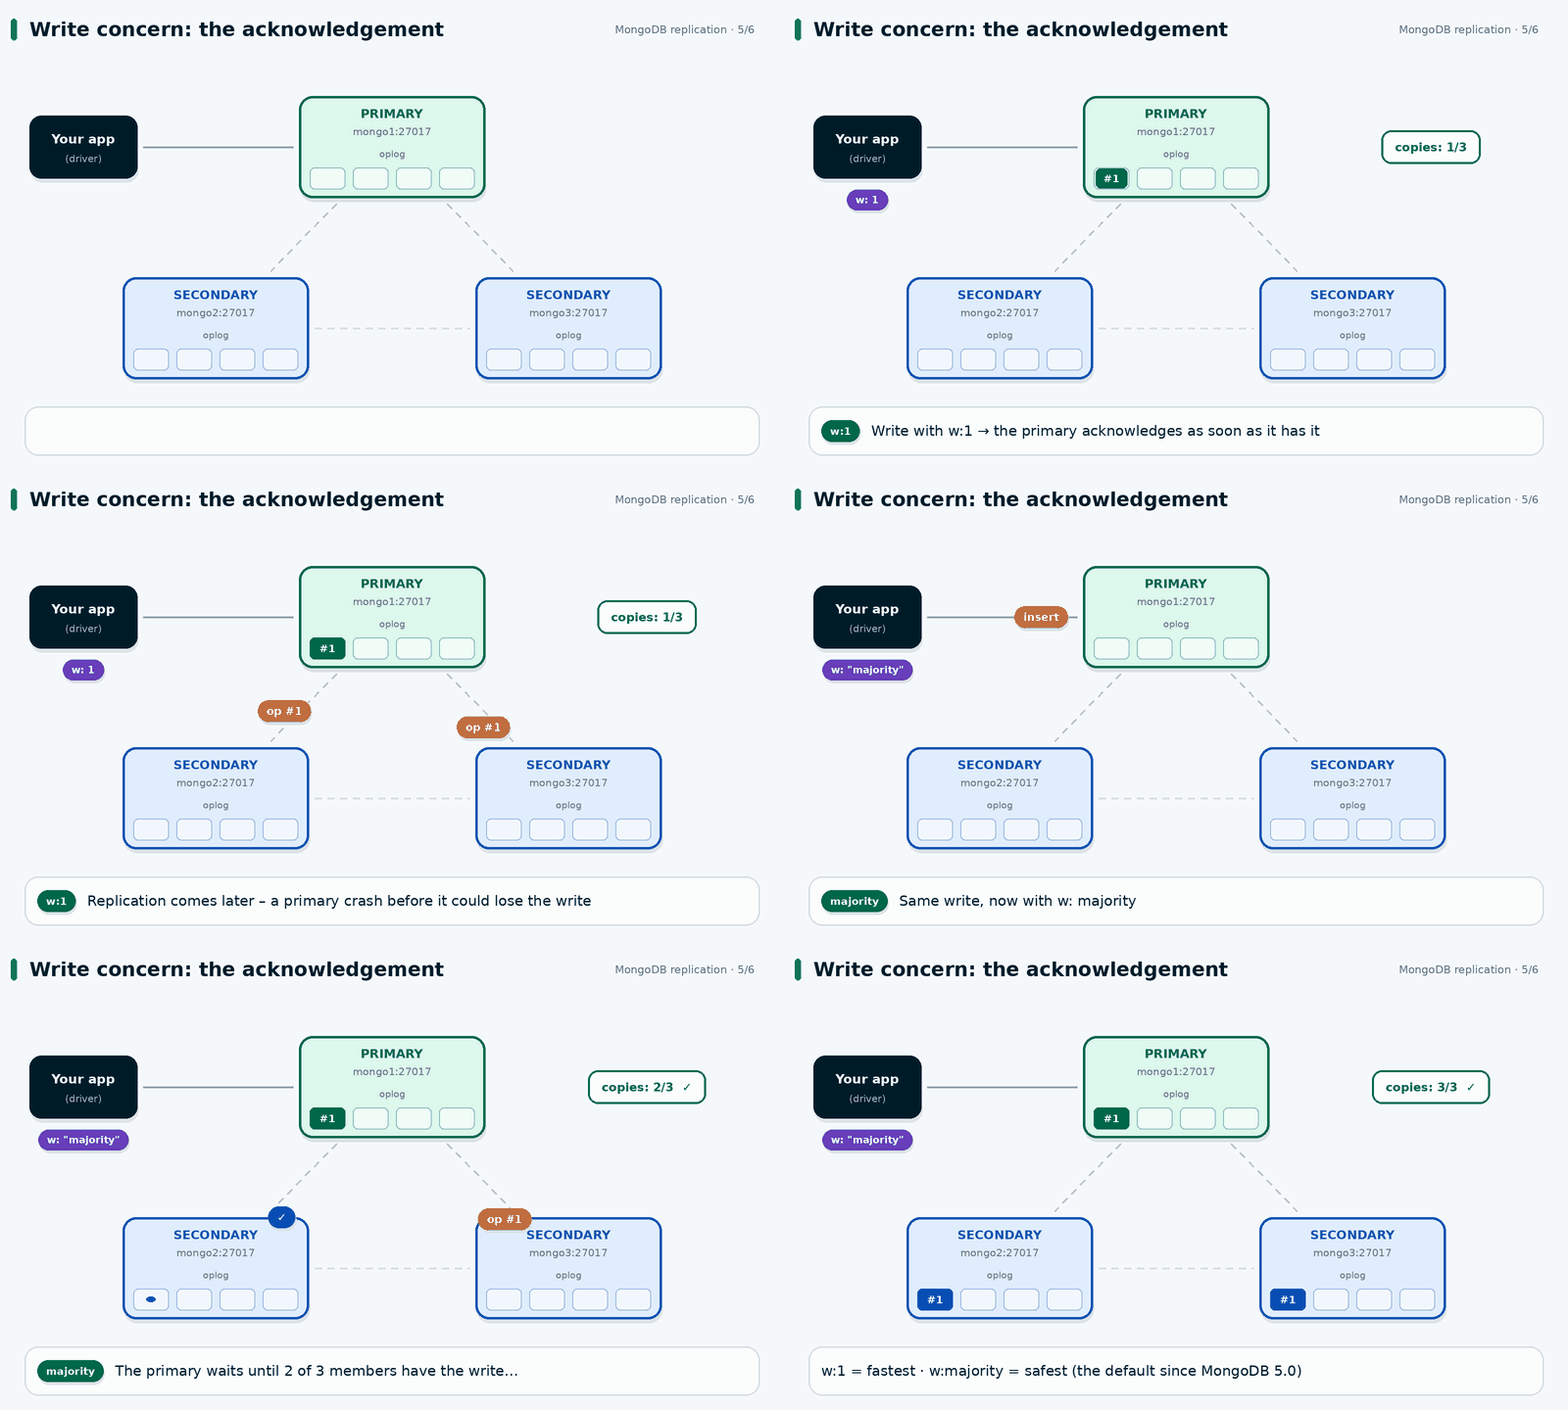
With w: 1 the primary answers right away. With w: "majority" it waits until most members have the write.
w: 1 means the primary acknowledges as soon as it has applied the write. That's fast. But look at the animation: at the moment of acknowledgement the data exists on exactly one machine. If the primary crashes before the secondaries pull that entry, and one of them becomes the new primary, that write is not on the new primary. When the old primary comes back, its extra writes get rolled back. MongoDB saves the rolled-back data to a file so you can recover it manually, but your app was already told "success". That's the dangerous kind of data loss, the quiet kind.
w: "majority" means the primary waits until a majority of members have the write before acknowledging. A write that was majority-acknowledged will survive a failover, because any new primary must have been elected by a majority, and that majority overlaps with the one that has your write. The cost is a bit more latency, since you wait for at least one replication round trip.
Since MongoDB 5.0 the default is w: "majority" in most setups, so you're probably already getting it. (Replica sets with arbiters are the notable exception. Check the docs if that's you.) Still, it's good to know what you're relying on, and you can set it explicitly per operation:
db.orders.insertOne(
  { item: "keyboard", qty: 1 },
  { writeConcern: { w: "majority", wtimeout: 5000 } }
)
wtimeout stops the call from waiting forever if a majority isn't available. One caveat: hitting the timeout does not undo the write. It only means "I couldn't confirm it in time". The write may well succeed later, which is why you shouldn't blindly retry without thinking about duplicates.
Or set it once on the connection:
// Node.js
import { MongoClient } from "mongodb";

const uri =
  "mongodb://mongo1:27017,mongo2:27018,mongo3:27019/?replicaSet=rs0&w=majority";

const client = new MongoClient(uri);
await client.connect();

const orders = client.db("shop").collection("orders");
await orders.insertOne({ item: "monitor", qty: 1 });
My rule of thumb: use majority for anything you'd be upset to lose (orders, payments, user accounts). Consider w: 1 only for data you can regenerate or truly don't mind losing, like some logging or metrics, and even then, measure before assuming you need the speed.
Read preference: who answers your queries?
Writes have one destination. Reads are more flexible, and that flexibility is both useful and a trap.
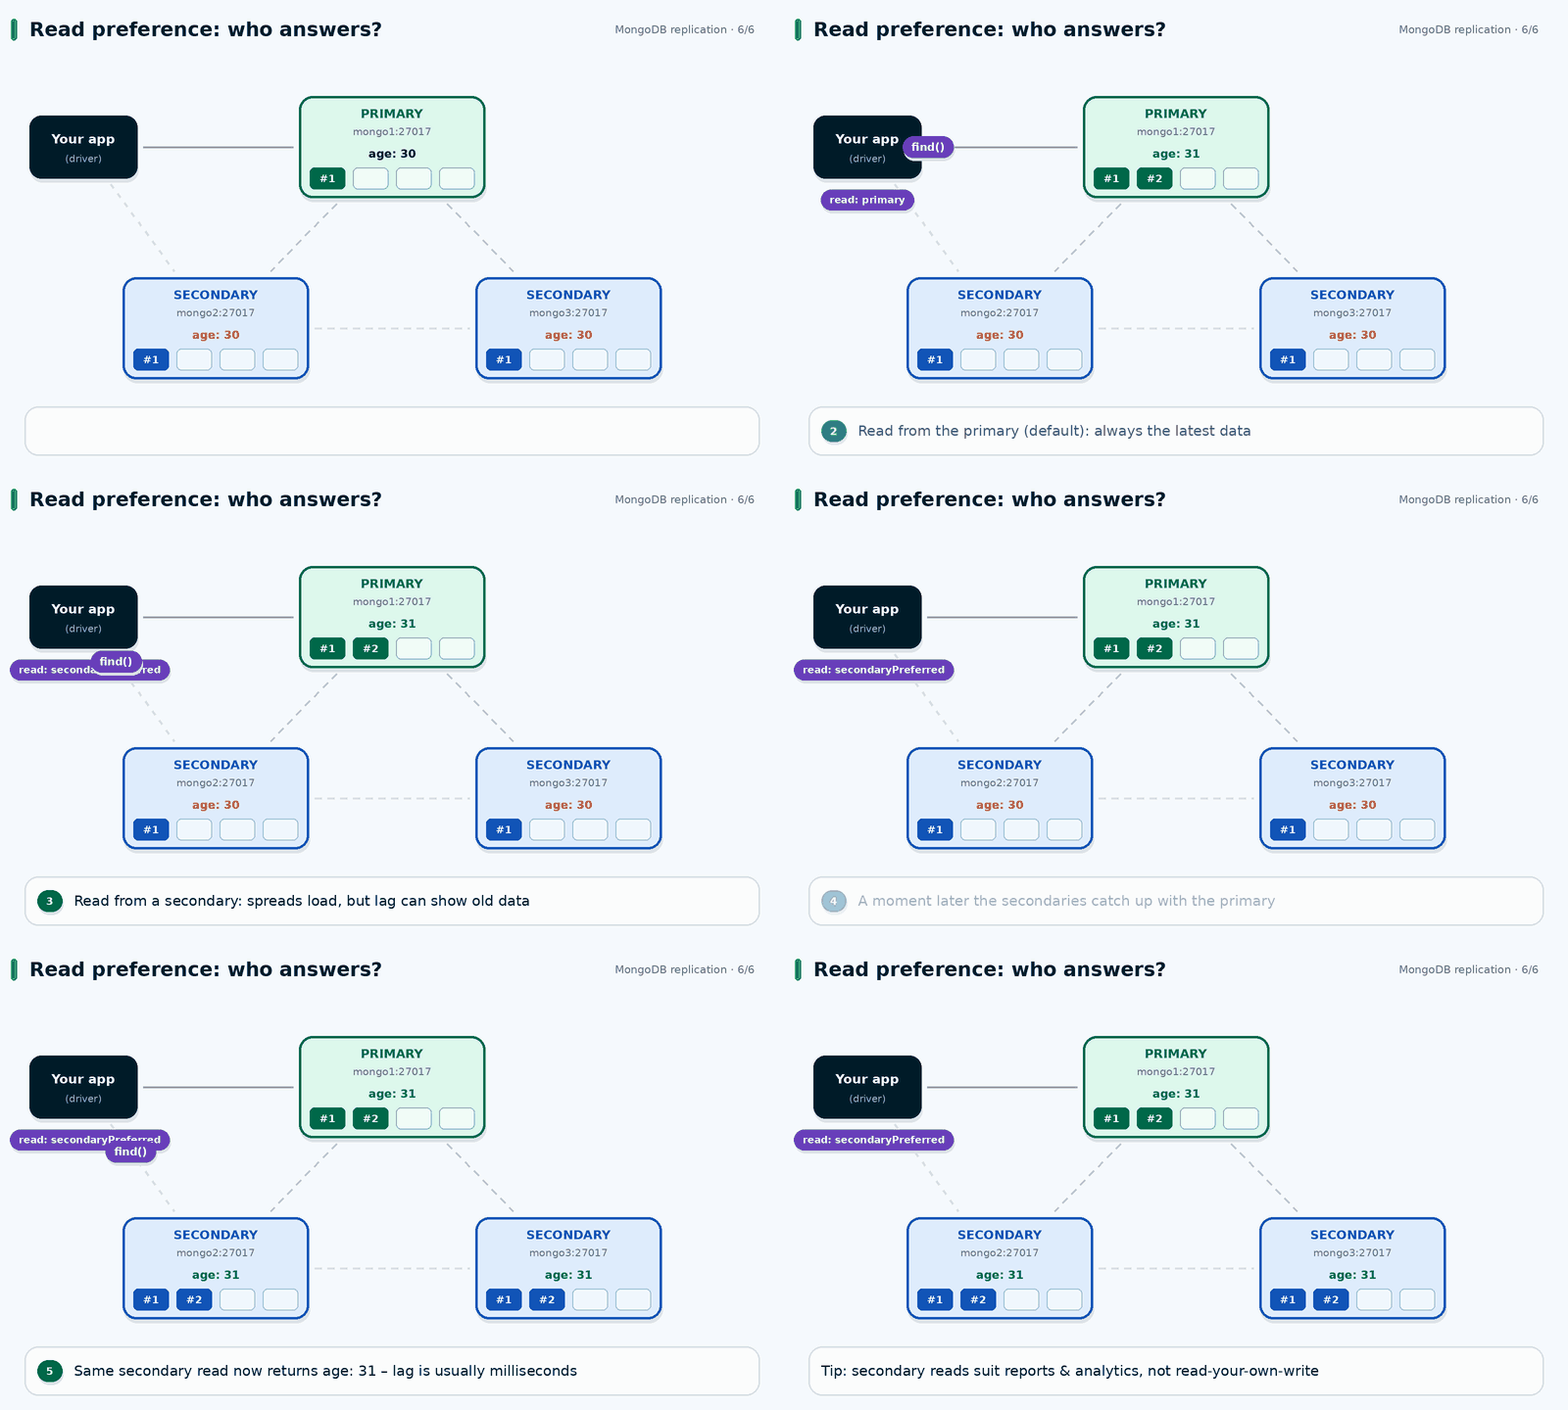
A read from the primary sees the latest data. A read from a secondary might be a moment behind.
By default your queries go to the primary. You can change that with read preference:
| Mode | Where reads go |
|---|---|
primary (default) | Always the primary |
primaryPreferred | Primary, but a secondary if there's no primary |
secondary | Only secondaries |
secondaryPreferred | A secondary, but the primary if no secondary is available |
nearest | Whichever member has the lowest network latency |
Why would you read from a secondary? To spread load, to keep heavy reporting queries off the primary, or to read from a server geographically closer to the user.
The animation shows the catch. Between the moment the primary applies a write and the moment a secondary has copied it, the secondary returns the old value. That gap is replication lag. Usually it's milliseconds. Under heavy load, or when a secondary is struggling, it can be seconds or worse. If your code does "save, then immediately read it back", and the read lands on a secondary, you can get confusing bugs where the thing you just saved isn't there.
You can set read preference on the connection string, or per collection:
// per connection
const client = new MongoClient(
  "mongodb://mongo1:27017,mongo2:27018,mongo3:27019/?replicaSet=rs0&readPreference=secondaryPreferred"
);

// or just for one collection
const reports = client.db("shop").collection("orders", {
  readPreference: "secondary",
});
const totals = await reports.aggregate([
  { $group: { _id: "$item", total: { $sum: "$qty" } } },
]).toArray();
In mongosh, remember that you have to opt in, because the shell protects you from accidentally reading stale data:
db.getMongo().setReadPref("secondaryPreferred")
My take: secondary reads are great for analytics, dashboards and reports, where a few seconds of staleness is invisible. They're a poor fit for anything user-facing where someone just changed something and expects to see it. If you need both fast reads and fresh data, scale the primary up before you reach for secondaries.
There's also a sibling setting called read concern, which controls what level of durability a read must have (local, majority, snapshot and so on). It's a separate topic, but if you're already using w: "majority" for writes, it's worth reading up on readConcern: "majority" as the matching half.
Keeping an eye on it
Replication mostly runs itself, which is also why it's easy to forget until something breaks. A few commands are worth knowing.
Is everyone in a healthy state?
rs.status()
How far behind are the secondaries?
rs.printSecondaryReplicationInfo()
source: mongo2:27018
    syncedTo: Thu Oct 29 2026 07:19:40 GMT+0000
    0 secs (0 hrs) behind the primary
source: mongo3:27019
    syncedTo: Thu Oct 29 2026 07:19:40 GMT+0000
    0 secs (0 hrs) behind the primary
How long is the oplog window? We saw this earlier with rs.printReplicationInfo().
What does the config look like?
rs.conf()
If you're running this in production, graph replication lag in whatever monitoring you use and alert on it. A secondary that's slowly falling behind is much easier to fix before it falls off the end of the oplog.
Mistakes I'd help you avoid
A short list, because most replica set problems fall into a handful of buckets.
Running two data-bearing members and calling it high availability. As we covered, two voters can't survive losing either one. Use three.
Putting all members on the same machine, rack, or availability zone. Three members on one physical host is a fancy way to have one point of failure. Spread them across failure domains.
Treating replication as a backup. This one hurts the most. If someone runs db.orders.drop() on the primary, that operation is faithfully replicated to every secondary within milliseconds. Replication protects you from hardware failure, not from human mistakes or bad deploys. You still need real backups and, ideally, a tested restore.
Never checking the oplog window. It shrinks when write volume grows. Check it before a long maintenance window, not after a secondary has fallen off.
Reading your own writes from a secondary. If something needs to be consistent right after a write, read it from the primary.
Forgetting w: "majority" on writes that matter, especially if you inherited an older setup where the default was different.
Listing a single host in the connection string. Give the driver all members plus replicaSet=. Otherwise failover only works if the one host you listed happens to be reachable.
Recap
Here's the whole thing in one breath. The primary takes writes and records them in the oplog. Secondaries pull that oplog and replay it, so they end up with the same data. Members ping each other every 2 seconds, and if the primary goes silent for around 10 seconds, the secondaries hold an election. A candidate needs a majority of votes to win, which is why you want an odd number of voting members. Write concern decides how many members must have a write before you hear "success", and read preference decides which member answers your queries.
Once you see replication as a log that gets copied plus a vote when someone disappears, the rest of the docs stop being a wall of settings and start reading like a list of knobs on a machine you understand.
Where to go next: try the experiments again with rs.stepDown() and with docker stop while a script is inserting documents in a loop, and watch what the driver does. After that, the natural follow-ups are read concern, transactions across a replica set, and sharding, which is how you scale writes beyond a single primary.
If this helped, or if something in the post doesn't match what you've seen in production, tell me in the comments. I'd like to hear about it.
Quick reference
// Create / inspect
rs.initiate({ _id: "rs0", members: [ /* ... */ ] })
rs.status()
rs.conf()

// Oplog
rs.printReplicationInfo()
db.adminCommand({ replSetResizeOplog: 1, size: 16384 })

// Lag
rs.printSecondaryReplicationInfo()

// Operations
rs.stepDown(60)
cfg = rs.conf(); cfg.members[0].priority = 2; rs.reconfig(cfg)
Connection string template:
mongodb://host1:27017,host2:27018,host3:27019/?replicaSet=rs0&w=majority&readPreference=primary
Discussion (0)
Comments are loaded live from this story.
Join the discussion — sign in to like stories and share your thoughts.